Crypto Chart Patterns That Actually Matter
learn the crypto chart patterns traders rely on, how to read them, and where they fail. clear examples, trade setups, and risk rules included.
Most advice on crypto chart patterns is too soft. It tells traders what a shape looks like, then leaves out the only parts that matter. A triangle, flag, or head and shoulders pattern is not a trade by itself. Without confirmation, invalidation, and a measured target, it is just a sketch on a chart.
That matters more in crypto than in slower markets. These patterns appear on a 24/7 tape, across spot and perpetuals, and they fail fast when liquidity thins or crowded positions unwind. The market does not care that a pattern is textbook clean. It cares where the breakout closes, who gets trapped, and whether the move can hold above or below the level that defines the setup.
Table of Contents
- Why Pattern Names Alone Will Drain Your Account
- The Four Pattern Families Every Crypto Trader Should Know
- Continuation Setups in Crypto Chart Patterns
- Reversal Setups in Crypto Chart Patterns
- The Six-Layer Confirmation Checklist
- Where Crypto Chart Patterns Fail
- Turning a Valid Pattern Into an Actual Trade
Why Pattern Names Alone Will Drain Your Account
A pattern name is a label. A trade needs rules. That gap is where most retail accounts leak. Traders draw the same formation after the fact, then act as if the drawing itself created an edge.
Crypto punishes that habit because price does not pause for a session close. A wick through resistance on a Sunday can look like a breakout and fail before the hour ends. In perpetuals, the same move can also be a liquidity grab, a stop run, or a funding-driven squeeze that dies as soon as the crowd is boxed in. If you want structure, you need structure around the pattern too.
Practical rule: If you cannot say exactly where the entry triggers, where the setup is invalid, and how the target is measured, you do not have a trade. You have a shape.
That is why a pattern name is never enough. The right question is not “Is this an ascending triangle?” The right question is “What closes confirm it, what breaks it, and what move does the structure justify?” That framing is closer to how floor traders think. It turns chart reading into execution, not decoration.
For traders who automate or mirror other traders, that distinction gets even sharper. A clean label without a clear trigger is a bad copy signal. A clean label with a defined breakout, stop, and target can be acted on. For that reason, many traders keep a written rule set next to the chart, and some use workflow tools such as copy trading software to keep execution disciplined rather than emotional.
The Four Pattern Families Every Crypto Trader Should Know
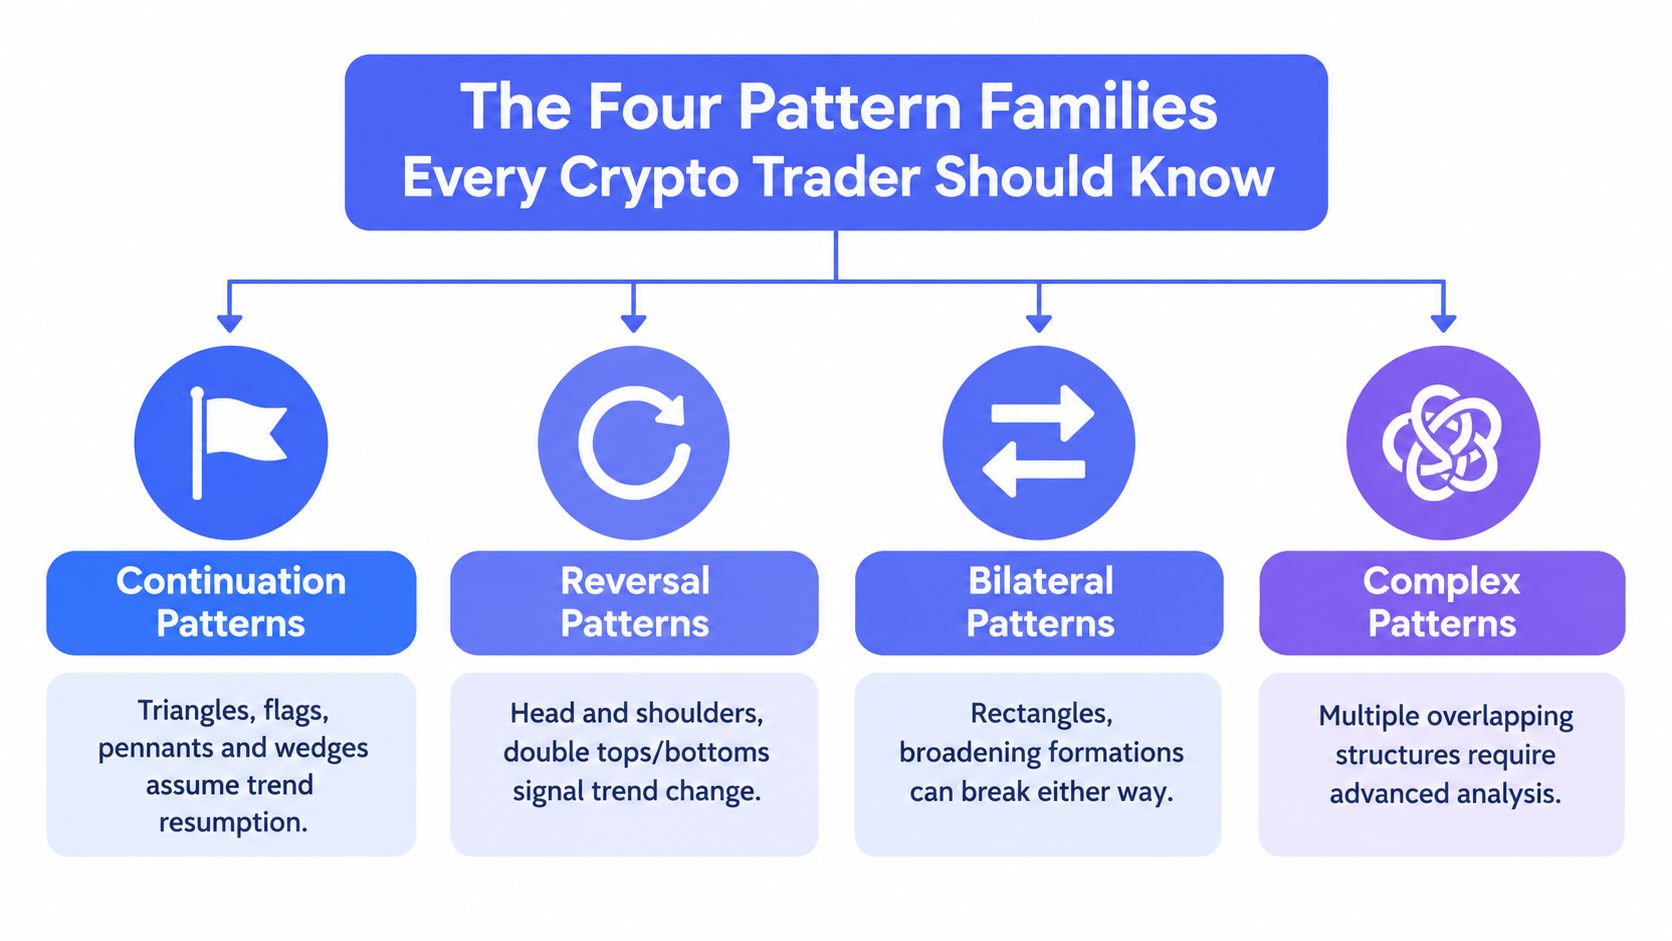
Crypto chart patterns fall into four practical families. The names change by platform. The logic doesn't. Once you know the family, you know what kind of move you're waiting for and what kind of failure would invalidate it.
Continuation patterns
These include triangles, flags, pennants, and wedges. They assume the prior trend resumes after a pause. The useful part is not the name, it's the compression. Price tightens, volume usually contracts, and then one side wins when the market escapes the range.
Reversal patterns
Double tops, double bottoms, and head and shoulders patterns sit here. They matter when a trend is already tired and price keeps failing at the same level. The break of the neckline is the part that counts, not the two bumps on top or the two lows underneath.
Bilateral patterns
Rectangles and broadening formations can break either way. They are less about prediction and more about readiness. You wait for confirmation because the structure itself says the market is undecided.
Complex patterns
These are overlapping structures, nested consolidations, and mixed formations that are harder to read cleanly. They demand more context and more patience. A trader who sees a clean setup too quickly inside a messy base is usually forcing the chart.
Useful vocabulary: breakout is the move beyond the boundary, retest is the market coming back to that boundary, measured move is the projected target, and invalidation is the point where the setup is no longer valid.
That language matters because every pattern later in this article uses the same grammar. A pattern without a breakout is unfinished. A breakout without a close is weak. A retest without rejection is a warning, not a green light.
Continuation Setups in Crypto Chart Patterns

Continuation patterns get most of the attention from active crypto traders for a reason. Digital assets often move in the same sequence, sharp impulse, then compression, then another attempt in the same direction. Triangles and flags show up because the market needs time to digest a prior move before it can extend.
Triangles need a real boundary
An ascending triangle only matters when the ceiling is clear and the higher lows keep pressing into it. The target comes from the triangle height projected from the breakout, not from a random round number. That measured-move logic keeps traders from overprojecting.
A weak triangle is easy to recognize after the fact. The test is the close. If price pokes above resistance and closes back inside, the pattern has not resolved. If the breakout closes and then retests the old ceiling as support, the structure has earned a tradeable interpretation. The chart stops being a drawing and starts being a plan.
Flags and pennants are pause patterns, not trend changes
A flag follows a strong impulse. The consolidation is shallow, tilted against the prior move, and meant to shake out weak hands. A pennant is tighter, more symmetrical, and usually shorter. Both are continuation structures, and neither should be traded before confirmation.
Chasing the pole is late. The cleaner entry is the breakout close, often with a retest if the market offers one. The stop belongs beyond the flag structure, not inside it, because a pattern that trades through its own boundary has failed.
Video walkthrough of continuation logic in practice
One practical point matters more than the shape itself. The move into the pattern should look orderly, not parabolic. When price already went vertical, follow-through often gets messy. Strong continuation setups form after a controlled impulse, not after a blow-off.
Reversal Setups in Crypto Chart Patterns
Reversal patterns matter when momentum starts to run out of room. Crypto gives you plenty of those moments, especially after crowded runs and heavy positioning. The shape tells you where the market has tried and failed. The neckline tells you where the market gives up.
Double tops and double bottoms need confirmation, not hope
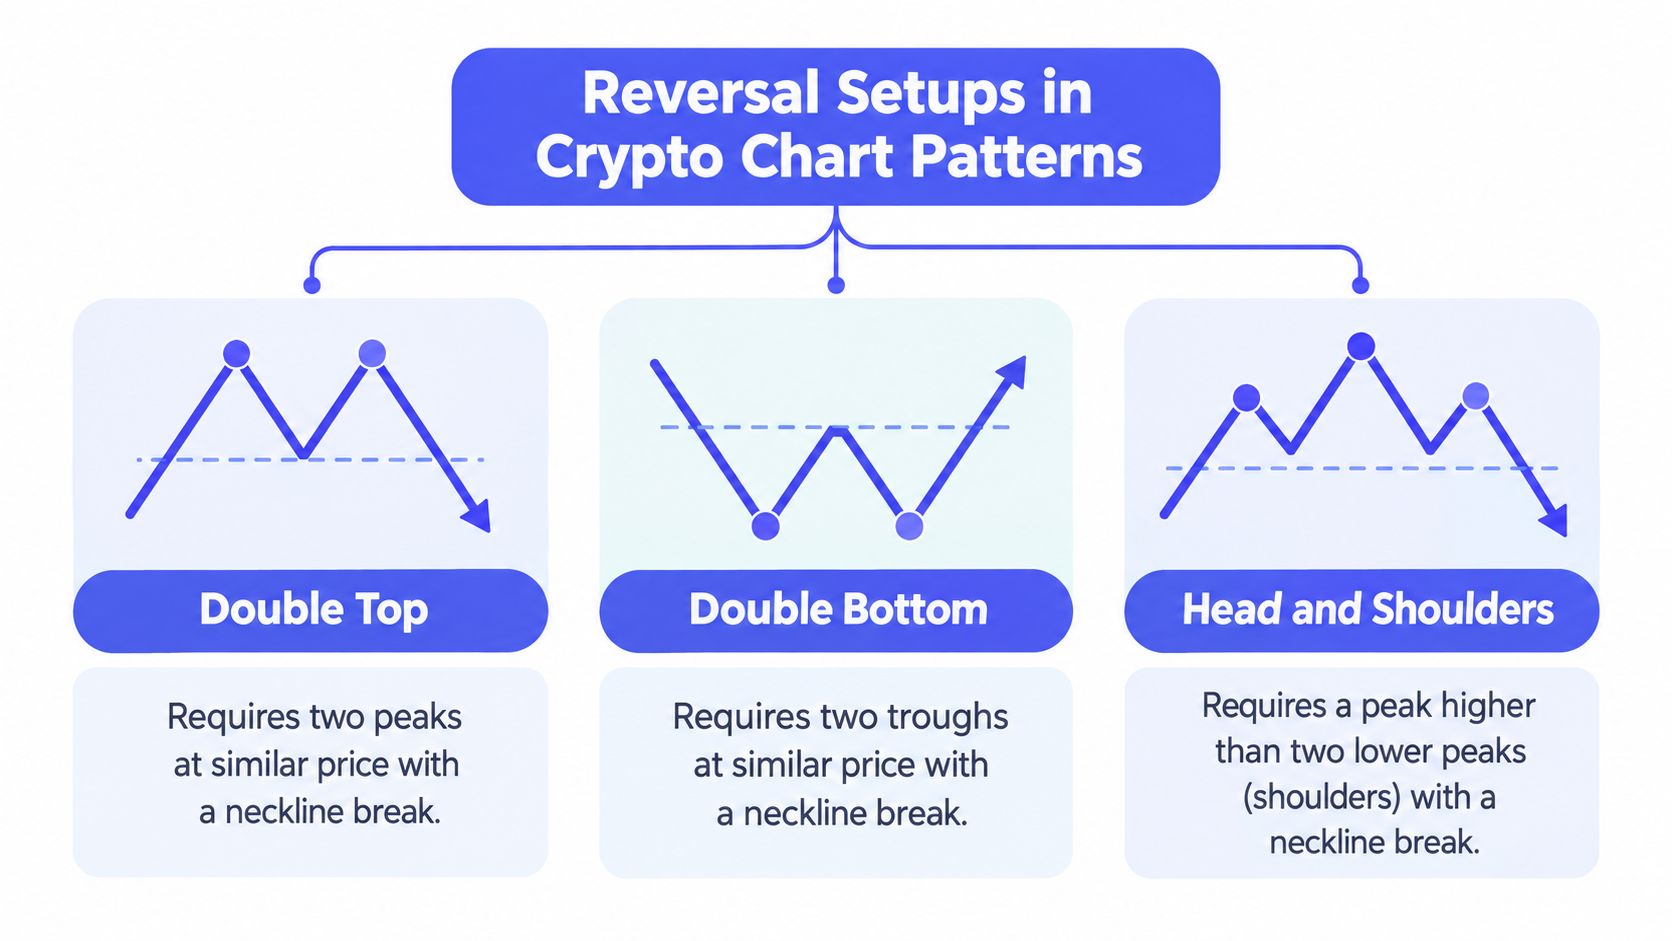
A double top is valid when price has risen first, printed two similar highs, and then closed below the support line between them. That line is the neckline. The downside target is the pattern height, measured from resistance to support and projected downward from the break. A double bottom works the same way in reverse, with two lows and a break above the middle peak. Finviz's technical-analysis chart pattern guide describes the double top structure and the measured-move target clearly, and classic guidance also treats the pattern as incomplete until price closes below the lowest low between the two peaks, then subtracts the height from that midpoint low to estimate the objective in its own measured way as outlined in the BIGAT technical-analysis manual.
That is the part traders skip. They see the twin highs or twin lows and trade anticipation instead of confirmation. The better read is simple. No close, no pattern. No broken neckline, no reversal.
Head and shoulders is a measured move, not a vibe
Head and shoulders uses the same logic. The neckline runs through the two troughs, the head marks the extreme, and the target is the head-to-neckline distance projected from the neckline break. That framework is standard in classical technical analysis and is laid out in IG's chart-pattern education.
Many traders get sloppy here. They try to short the right shoulder before the neckline breaks. That's an opinion, not a setup. The actual trade begins when the neckline gives way on a closing basis, and the stop belongs above the right shoulder or the failed retest, not inside the pattern.
The cleanest reversal pattern is the one that already failed twice before you touch it.
The Six-Layer Confirmation Checklist
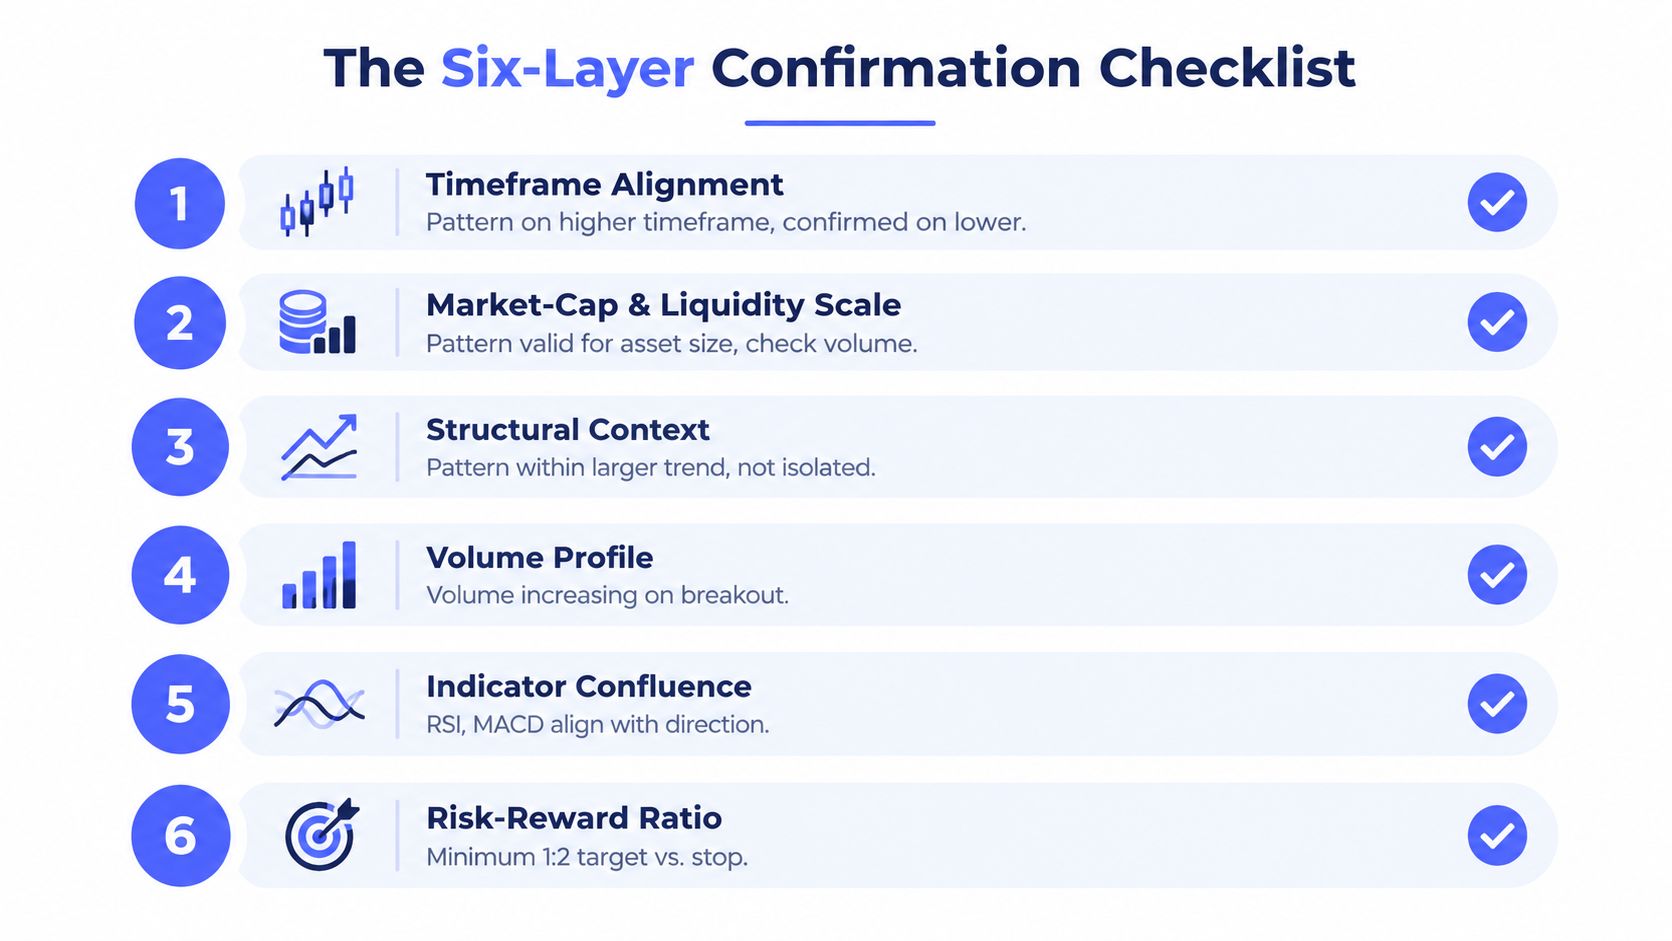
A chart pattern becomes tradable only after it survives a full checklist. Skip one layer and you are guessing. Stack all six and you get something closer to a rule-based setup than a chart drawing.
Start with the higher timeframe
A 4-hour pattern should agree with the daily structure. If the higher timeframe is still pointing the other way, the lower timeframe setup is weaker. This is why so many neat-looking intraday patterns fail. They are fighting the larger tape.
Check liquidity and scale
The same shape means less on a thin pair than it does on a major. A low-liquidity coin can print almost anything because a single wallet can distort the chart. Bigger, cleaner markets usually give cleaner structure.
Read the broader context
A pattern sitting in the middle of a wider trend deserves less trust than one forming at a real inflection point. Support, resistance, and swing structure tell you whether the market is compressing inside a trend or trying to change one. That context is what separates a pause from a reversal.
Demand volume on the breakout
A quiet breakout is suspect. A breakout that expands on volume is doing the work the pattern needs. Technical guidance from CryptoSlate's chart-reading guide emphasizes candle completion, volume confirmation, and invalidation as part of a multi-layer setup rather than a single visual cue.
Wait for confirmation
A wick is not enough. A close beyond the boundary is stronger, and a retest that holds is stronger still. That extra patience saves traders from chasing fake pushes through resistance that vanish two candles later.
Define the invalidation before entry
If the pattern breaks its boundary in the wrong direction, the trade is wrong. That should be obvious before the order is sent. A trade without an invalidation point is not a setup, it is exposure.
Where Crypto Chart Patterns Fail
Crypto chart patterns fail most often at crowded levels. The market trades around the same obvious highs, lows, neckline breaks, and triangle edges, so stop clusters pile up where everyone can see them. A wick through resistance can flush shorts, trigger breakout buyers, then snap back once the liquidity grab is done.
Heavy use of borrowed capital changes the way levels trade. When many traders use borrowed capital, everyone sees the same neckline and triangle edge, which concentrates stops just beyond obvious levels. That is where the market can invalidate a pattern before the expected move has a chance to develop.
Why crowded levels keep getting run
A pattern also weakens when the move into it is too vertical. Parabolic legs usually need more digestion than traders want to give them, and a clean measured move becomes less reliable when the structure is built on exhaustion instead of consolidation.
Low timeframes create another trap. Every small flag can look tradable if you stare at enough candles, but most of that action is just chop. Higher-timeframe structure usually gives the cleaner read, because the levels matter more and the invalidation point is less arbitrary.
Crypto auto trading only helps when the pattern logic is already sound. Automation can execute a bad read faster, or it can enforce a good read without hesitation. The edge sits in the setup and the rules around it, not in speed alone.
Turning a Valid Pattern Into an Actual Trade
A valid crypto chart pattern is only the start. The trade comes from execution. The breakout close sets the trigger, the retest shows whether price has accepted the new level, and the measured move gives the target. Write that plan first. Then choose the order type that fits it.
Order logic should mirror the chart logic
A stop-market entry on the breakout close is cleaner than guessing on a wick. A conditional OCO setup can place the stop and target at the same time, which cuts down on hesitation. Some traders wire alerts into TradingView and let the alert fire the order on major venues such as Binance, Bybit, or OKX, and some map that workflow with a crypto bot for beginners guide so alerts translate into conditional orders without guessing on wicks. The tool changes. The logic stays the same.
Copy trading only works with disclosed risk
If you mirror another trader, the main question is not just whether they found the pattern. It is whether their sizing, stops, and exit rules are visible. Past performance does not predict the next setup, and hidden risk can make a clean chart read look better than it is. A martingale reset does the same thing. It hides risk until the drawdown shows up.
Keep the risk checklist boring
- Position size: keep it capped at a small slice of capital.
- Stop placement: place it at the invalidation point, not where it feels comfortable.
- Target: use the measured move from the pattern.
- Trade log: write down why the entry was taken and what would prove it wrong.
That sounds plain because it is. Good pattern trading is mostly plain. The chart gives you a structure, the checklist tells you whether it deserves capital, and the execution rules keep the trade from turning into a guess.
copyfomo gives you a way to mirror verified trades from traders on fomo without turning your own wallet into a black box. If you already follow patterns like these, it keeps the execution side tighter and more transparent. Visit copyfomo to start the bot on Telegram.
stop reading. start copying.
pick a trader from the fomo leaderboard, set your size, and the entries and the exits land in your own wallet while you sleep.
open copyfomo on telegram →