Memecoin Trading Explained: Screening, Slippage and Risk
memecoin trading explained: how liquidity, slippage and manipulation shape outcomes, plus the checks to run before you trade any token.
Memecoin trading volume averaged $1.1 billion a day in 2023. In 2024 it averaged $9.7 billion a day, with a peak of $87.4 billion, according to the CoinGecko 2025 State of Memecoins Report.
That number counts entries. The exit is a separate market, and it's the one that decides whether a trade was any good. A token can show a 300% gain on a chart while the pool under it is too shallow to absorb your sell anywhere near the mark.
So this guide works backwards. It starts with what a memecoin is, then spends its time on pool depth, slippage, fake volume and the limits you write down before the first order. It ends with how to test a copy setup at a size where being wrong is cheap.
Table of Contents
- How Memecoin Trading Works on Decentralized Exchanges
- Liquidity, Slippage and Position Size
- Screening Tokens and Spotting Fake Performance
- Why Copied Trades Often Differ From the Source
- Risk Controls and Limits to Write Down Before Trading
- Test Copy Trading at Small Size
How Memecoin Trading Works on Decentralized Exchanges
A memecoin is a token built around a mascot, a meme, or a community joke. No product sits behind the contract, and no cash flow sets a value. The price is whatever attention is worth that hour. Attention leaves faster than it arrives, and the exit is where that gap shows up in the fill.
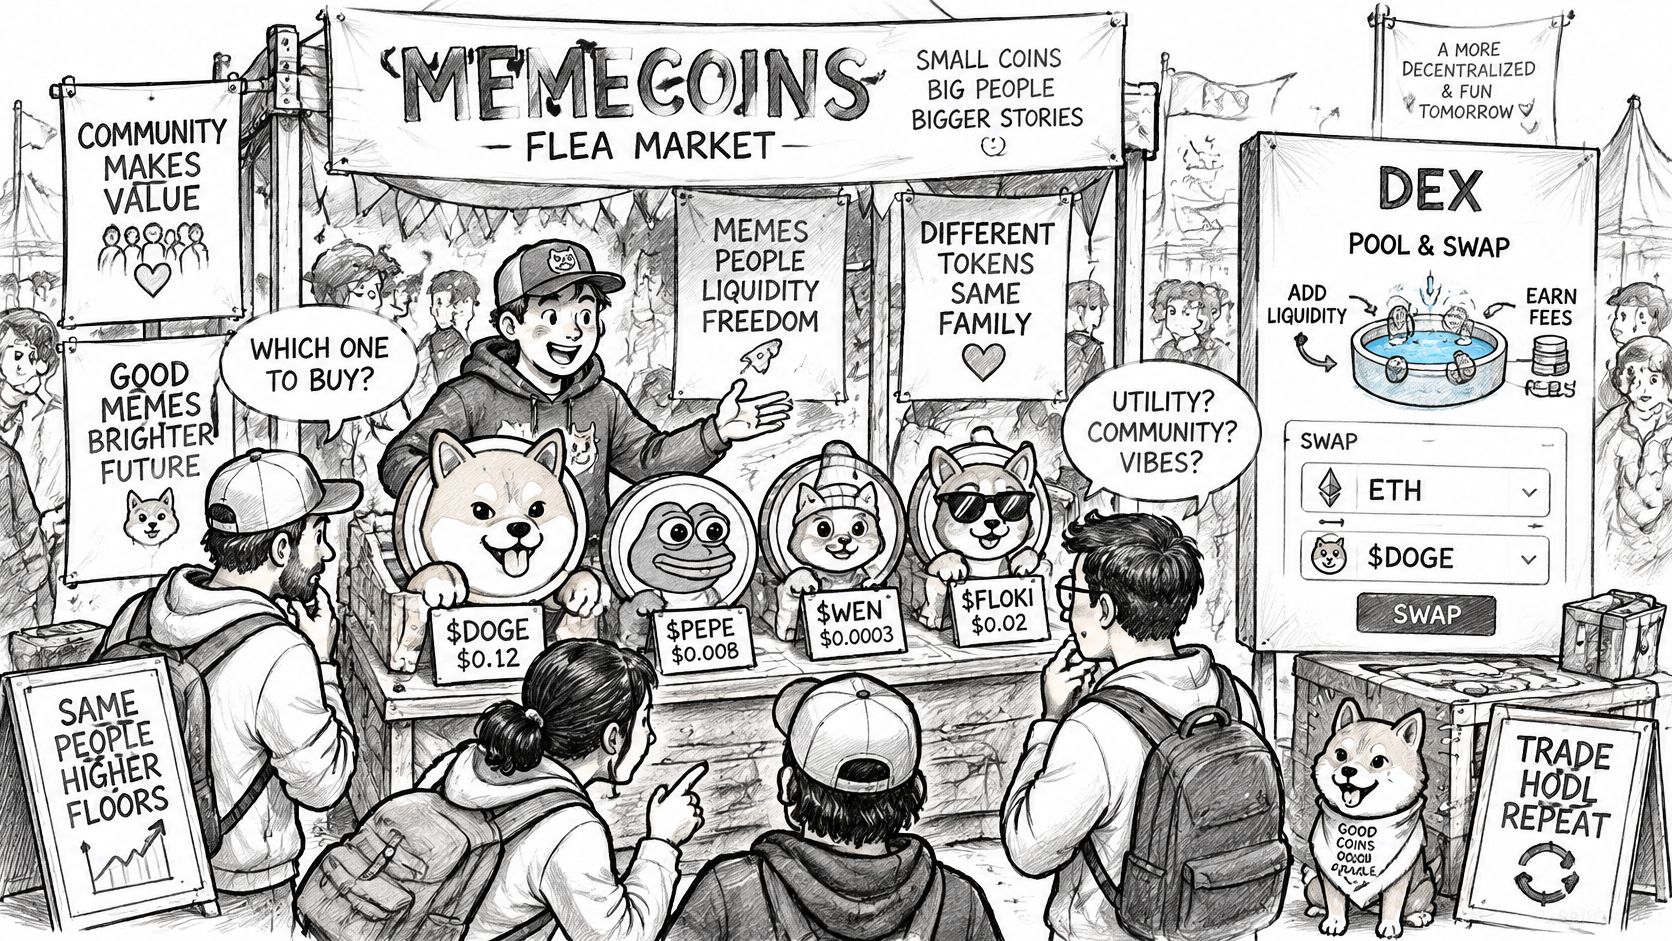
Almost all of it trades in liquidity pools on decentralized exchanges, paired against a base asset such as SOL, ETH, or BNB. There is no order book and no queue of buyers waiting to be matched. A buy pushes the price up along the pool's curve. A sell pushes it down. Pool depth decides how far one trade moves the quote, which is why the same dollar amount can be quiet on one token and violent on another. On a thin pool, the sell that closes a winning trade is the expensive part, not the entry.
Market cap is the quoted value of circulating tokens at the last trade. The category's first major cycle peaked at roughly $88.0 billion on October 29, 2021, and a later cycle reached an estimated $150.6 billion in December 2024, an increase of about $62.6 billion, per the SEC staff statement on memecoins. Those figures show how fast speculative money arrives. They say nothing about how much of it could leave at the quoted price, because thin pools reprice on modest sells. A mark on a chart and a size you can get out are two different numbers.
Then the churn. Most memecoins launched in 2024 never sustained trading. Solidus Labs put the failure base rate higher still: about 98.7% of Pump.fun tokens displayed characteristics of pump-and-dump schemes or rug pulls, in its Solana rug pull and pump-and-dump report. A chart that printed for a few hours is not a market you can rely on when you want out.
Sort every token you see into three buckets before you size anything:
- Launched. A contract exists and a chart is drawing. That is the whole list of qualifications.
- Trading. Real holders, real two-way flow, buyers and sellers meeting each other rather than a bot trading with itself.
- Liquid enough to exit at your size. You can sell the entire ticket without gapping the price.
Most of the market never leaves the first bucket. I treat the bucket as the first decision, ahead of the chart, because a live line is not the same thing as a sell you can complete.
Liquidity, Slippage and Position Size
Slippage is the distance between the price on your screen and the price your swap fills at. In an automated market maker the two are never identical. A deep pool makes the gap small. A shallow pool makes it the most expensive part of the trade.
The base rates are worse than most first-time buyers assume. A Solana study of Pump.fun activity in Q4 2024 found the platform generated up to 71.1% of all newly minted Solana tokens and 40% to 67.4% of total decentralized exchange transactions, yet fewer than 2% of launched tokens reached the market cap needed to progress to Raydium. Thin, short-lived pools are the norm. Deep ones are the exception you occasionally get to trade.
Here's the method I'd run before every entry.
- Read usable reserves, not market cap. The pool's actual token and quote balances are the only thing your order touches. A $20 million cap sitting on a $40,000 pool is a $40,000 pool with a big number printed above it.
- Divide your ticket by those reserves. Buying $1,000 into a pool holding $25,000 of the quote asset means you're pushing against 4% of that side. That ratio sets your fill, not the trend.
- Estimate impact both ways, then assume the exit is worse. In most memecoin pools the liquidity you saw going in has thinned by the time you want out, because everyone else is selling the same direction.
- Set the limits before you click. A maximum slippage tolerance, tighter than the venue default on anything launched in the last few hours, and a cap on what share of pool reserves one order may take. A small single-digit percentage is a reasonable ceiling for a first run.
- Test small, then compare. Send a minimum-size order and check the fill against the quote you saw. If the gap is wider than your tolerance, the pool can't take your real size, and a bigger ticket only makes the fill worse.
The mechanics behind that gap are worth ten minutes of reading in this explainer on slippage in crypto, because the number you set is the number that decides whether a copy fills or fails.
The rule that survives every market: the exit sizes the trade, not the entry. When several holders hit the same thin pool together, someone is last in line, and the last seller takes the worst price of the day.
Screening Tokens and Spotting Fake Performance
Screening is where most of the money gets saved, and it's a checklist you run identically every time. Eight rows. Two or more reds and you skip the token. Another one launches in an hour.
| Check | Red flag | Why it matters |
|---|---|---|
| Liquidity depth at intended size | Pool too shallow for your ticket | Exit price worsens as the pool drains |
| Liquidity lock or removability | Creator can remove the pool | Liquidity can disappear and leave the token unsellable |
| Holder concentration | A small group of wallets holds most supply | A few sellers can push the price down sharply |
| Creator and deployer allocation | Large share held by the deployer or linked wallets | Deployer-controlled exits are a common failure path |
| Volume to liquidity turnover | Volume far above liquidity | Volume may be wash traded rather than real demand |
| Buy-to-sell ratio trend | Sell side rising quickly | Early holders may be exiting |
| Unique wallets behind volume | Few wallets producing most trades | Activity may be coordinated rather than organic |
| Token age | Launched minutes or hours ago | Most new launches never reach durable liquidity |
Run the table in whatever order you like. What matters is that you run it while calm, against the pool rather than against the chart. If you want a faster read on whether a token is holding up, a meme coin tracker that follows liquidity and flow beats refreshing the chart.
The signals that fake a clean chart
Pump-and-dump. Promoters create and promote a token, sell once the price rises, and leave later buyers holding fast losses. The chart looks like a strong launch from the outside. It's an exit schedule.
Wash trading. One controlling group trades with itself to manufacture volume and activity. The counter climbs, the leaderboards light up, and no independent demand exists underneath. If you want the concrete tells, read how to spot artificial meme coin volume before you trust a turnover ratio.
Rug pulls and soft rugs. A deployer either pulls the pool in one transaction or bleeds it out gradually after buyers arrive. The gradual version is harder to see and far more common, and it's the reason liquidity lock status belongs near the top of the table.
Why a big green number can be a liquidity illusion
A cross-chain study of 34,988 tokens across Ethereum, BNB Smart Chain, Solana and Base reported that 82.89% of tokens showing returns above 100% exhibited evidence of artificial-growth techniques, including wash trading and liquidity-pool based price inflation, per the cross-chain analysis of artificial growth in memecoins. The same study linked those patterns to later pump-and-dump or rug-pull activity and identified more than 17,000 victim addresses with realized losses exceeding $9.3 million.
The mechanism is simple once you've seen it. A small buy in a shallow pool moves the mark price a long way. Unrealized PnL looks enormous and there's no depth to sell into it, so the gain exists on screen and nowhere else. Wash-traded volume does the same job on the activity metrics, inflating a number while adding no buyer.
A mark price is a quote, not an offer. The only number that counts is the fill you get when you actually sell.
Judging the trader, not just the token
Two more checks belong to the person whose trades you're considering, not the token:
- Realized, fully closed PnL. Gains still sitting in an open position are marks. Closed trades have already paid gas, slippage and fees, which is the only version of the result that existed in cash.
- Repeatability across tokens and venues. One runner on one token is a lottery ticket with a screenshot attached. The same process producing results across several tokens and more than one venue is closer to skill.
A token that passes all eight rows can still go to zero. The table filters entries. It doesn't forecast prices, and it doesn't replace sizing.
Write your limit before you open the chart: a maximum you'll risk on one token, an amount you'd shrug at losing in full, and the single red flag that ends the conversation for you. Mine is removable liquidity. Yours might be holder concentration. Decide now, because you won't decide it well at 3am watching a chart fall.
Why Copied Trades Often Differ From the Source
A leaderboard PnL is a record of one wallet's fills: that size, that second, that pool. You cannot buy the record. Copying the same token later is a different trade, and the exit is where the difference usually shows up in cash.
The source order lands first. Yours follows. On a memecoin pool that reprices every block, a one-second lag is already another price. Fixed tickets and proportional sizing both change the impact. Scale a large source position the wrong way and the follower order is still too big for the reserves left. Your swap then moves the pool a second time. Two buyers of the same token are not independent events.
Exits fail more often than entries. The source sell can fill you at a worse price, or not fill you at all, because other swaps change reserves before your transaction settles. Thin liquidity raises that price impact. Gas, priority fees, failed transactions and partial fills sit under the leaderboard number. Displayed gains are not cash after those costs.
Crypto prices can move quickly, so a mirrored fill can land at a different price from the source trade because the market shifted between the two. Sizing caps and a pause control limit how much of that gap you take. They do not remove the risk of loss.
The test I'd run on any copy setup: log source and follower results on the same trades at one-second, five-second and ten-second delays, and record per-trade slippage on every mirrored swap. Separate three numbers a leaderboard blends. Trader skill is one. Your latency is another. Liquidity exposure at your ticket size is the third, and it is usually the one that turns a paper gain into a poor exit.
Practical rule: grade a copy setup on the follower's fills, not the source's entries.
A feed that shows each mirrored swap with its timestamp and displayed slippage, as copyfomo does, makes that gap visible on the first day. It does not close it. The source trader was there first, and that order cannot be reversed.
If you are new to how mirroring is wired, this guide to DeFi copy trading covers the plumbing. A leaderboard rank is a starting list. It is not a result you inherit.
Risk Controls and Limits to Write Down Before Trading
A green entry is not a finished trade. On a thin memecoin pool, the exit is where paper gains turn into a poor fill, or into a token you cannot sell at all. Controls are unglamorous. They are also what keeps a bad week from becoming a closed account. Each risk below has a cause and a lever. Set the lever before you need it.
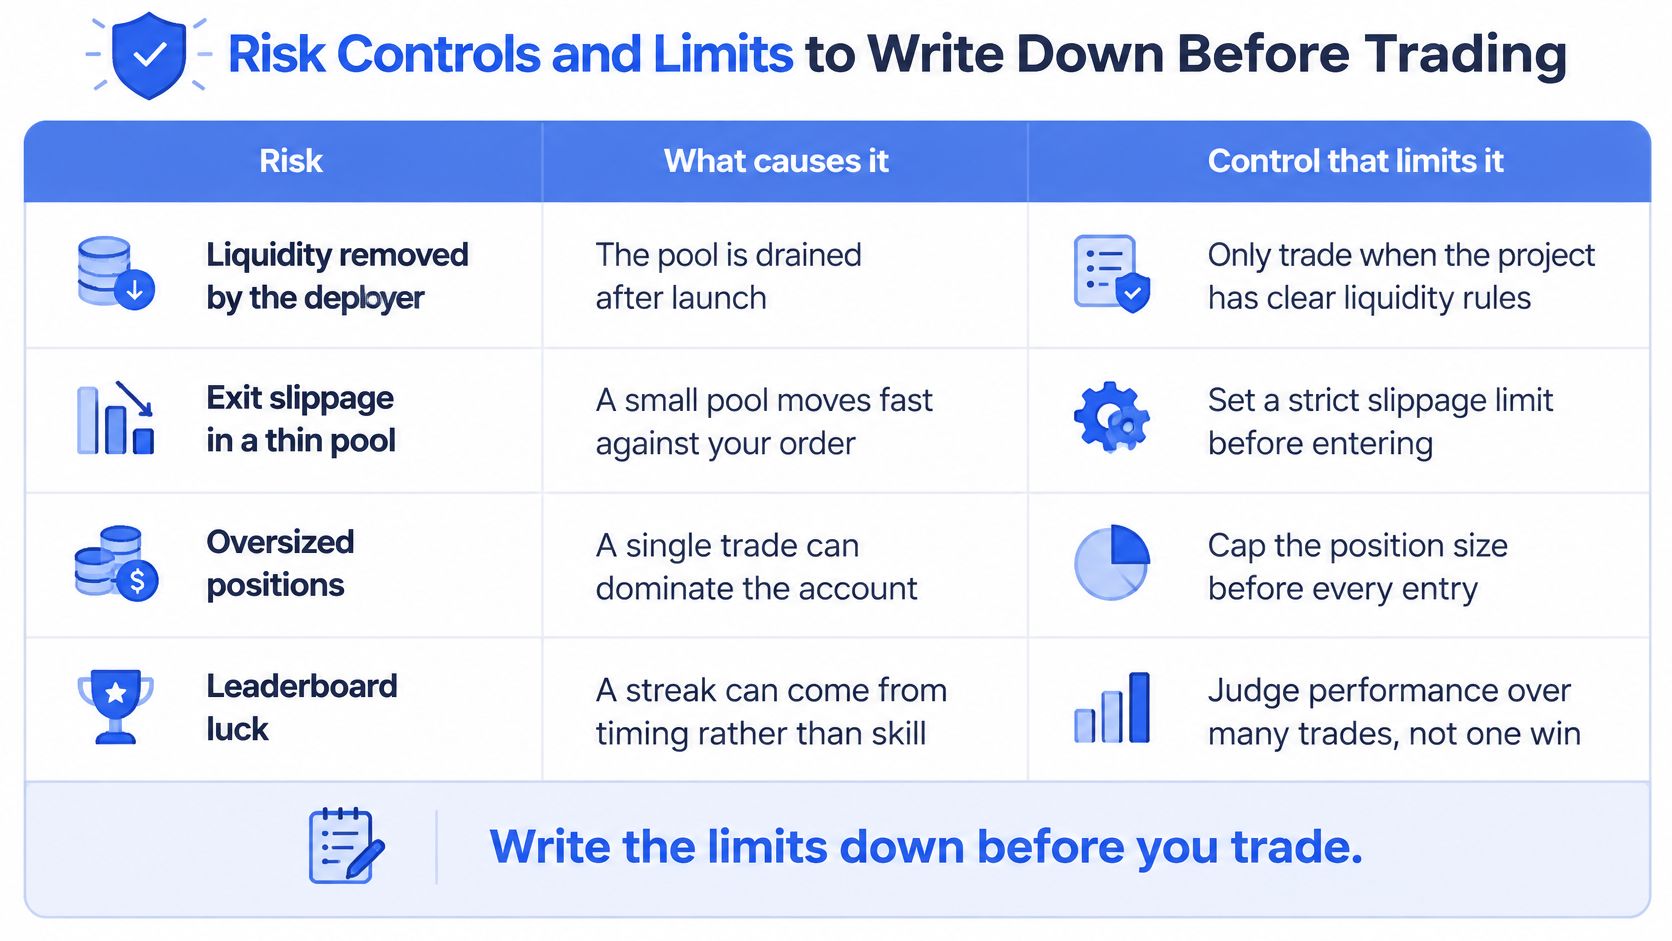
| Risk | Cause | Control |
|---|---|---|
| Liquidity removed | Deployer pulls the pool | Skip unlocked or removable liquidity and set an exit plan before entry |
| Exit slippage | Thin pool at exit size | Maximum slippage setting and a maximum share of pool reserves |
| Oversized position | Ticket too large for the token | Fixed sizing and a per-trade cap |
| Leaderboard luck | Short streak of wins | Rank traders on realized closed PnL over a longer sample |
| Token cannot be sold | No available trading route | Keep the position visible and track it until a route returns |
| Platform and custody | Funds held outside your control | Keep funds in a wallet you control and check permissions before funding |
| Sudden market move | Speculative volatility | Pause control that stops new copies |
The SEC investor alert on crypto asset securities sets out the risk list it wants investors to keep in view: market volatility, illiquidity, hacking, malware, technical failures, fraud, manipulation, and the possibility that an asset may no longer be tradable. It states that crypto asset investments can be exceptionally volatile and speculative, and that the risk of loss for individual investors remains significant.
Mirroring another person's fills leaves token risk, execution risk, market risk and platform risk in place, and past performance does not predict results. What a written limit can do is make the exposure explicit. Explicit is not the same as smaller.
The limits to write down before the first trade
- Maximum per token. One number, in dollars, that you would accept losing completely without changing your week.
- Maximum share of pool reserves. The percentage of the pool's usable side one order may take. Write it as a hard ceiling and reject trades above it.
- Maximum slippage. The point where a fill stops being the trade you planned and becomes a donation to the pool.
- The skip list. Two or three structural red flags, named in advance, that end the idea regardless of how good the chart looks. Free-floating liquidity belongs on that list.
- The pause rule. The condition that stops new copies: three failed fills in a row, a drawdown on the mirrored account, or a day you are not watching.
Custody belongs on that list too. copyfomo is non-custodial, so you keep your keys and your wallet, and you grant a trading allowance from your own wallet that you can revoke at any time. Tokens that cannot be sold stay in your wallet, the verdict is re-tested every few hours, and the position comes back if a route becomes available. Trading still involves risk, and nothing in a bot's output is financial advice.
Build in one order. Caps first, because they apply to every trade whether or not you are paying attention. Pause rules second, because they are what you will reach for when a pool thins out or a route fails. Copies last. A bot configured the other way around is added risk with extra steps.
Test Copy Trading at Small Size
A first copy should be small enough that a bad exit is a measurement, not a wiped week. Thin pools and a fill that lands about a second behind the source can turn a green entry into a worse sale. The test is whether your ticket still clears at a price you can live with.
Send /start to @copyfomo_bot from copyfomo.com. Pick the trader with /leaderboard or /find, and favor a record built over many filled trades rather than a hot week. Set the per-trade cap and the ticket size in the bot. Those limits sit on that trader. Write the slippage you will not accept in your own notes. The bot does not take a maximum-slippage setting. Each mirrored swap shows its timestamp and slippage in the live feed, which is how you measure the gap between the source fill and yours.
Fund only the amount you are willing to lose entirely, then start at the smallest ticket the setup allows. Watch the first fills. Compare each one with the source trade and with the quote you saw a moment earlier. Raise the ticket only after that gap is inside the tolerance you wrote down. If fills stay worse, the mismatch is your size against pool depth, not the name you copied.
copyfomo mirrors that trader's buys and sells into a wallet you control, at your size, including while you are asleep, so an entry opened overnight can be closed overnight. You keep the keys and grant a trading allowance you can revoke. Market-level figures for a sanity check sit in the copyfomo data room. Trading involves risk. Past results do not predict the next fill, and none of this is financial advice. Run the first copy from copyfomo at a size where a bad fill costs a lesson, not the position.
stop reading. start copying.
pick a trader from the fomo leaderboard, set your size, and the entries and the exits land in your own wallet while you sleep.
open copyfomo on telegram →