Onchain Analysis Tools: 10 Platforms Traders Actually Use
a trader's guide to onchain analysis tools: ten platforms for wallet research, pnl tracking and liquidity checks, with honest limits and practical use.
Onchain analysis tools don't make you money. They remove guesswork. That's a narrower job than most roundups admit, and it's the only honest way to judge them.
Traders hire these tools for three tasks. Address discovery finds who's trading. PnL tracking checks whether that wallet closes trades well. Liquidity analysis checks whether you can enter and exit without moving the price against yourself.
A normal workflow is simple. Find a wallet. Verify its track record across filled trades, not screenshots. Check the token pool. Then decide. Most tools do one step well and the rest poorly, so this list groups ten onchain analysis tools by task, not by brand.
Scale explains why labels change. The Chainalysis 2025 crypto crime introduction estimated illicit addresses received $40.9 billion in 2024, equal to 0.14% of attributed on-chain volume, and later revisions raised prior figures as new addresses were identified. Treat every ranking as provisional.
Reading data isn't financial advice. Past performance does not predict results. Copy trading carries risk, including total loss on a copied position.
Table of Contents
- 1. copyfomo
- 2. Nansen
- 3. Arkham
- 4. Defined
- 5. Birdeye
- 6. Bubblemaps
- 7. Solscan
- 8. Dune
- 9. DeFiLlama
- 10. GeckoTerminal
- The Ten Onchain Analysis Tools at a Glance
- From Research to Execution Picking Your Stack and Managing Risk
1. copyfomo
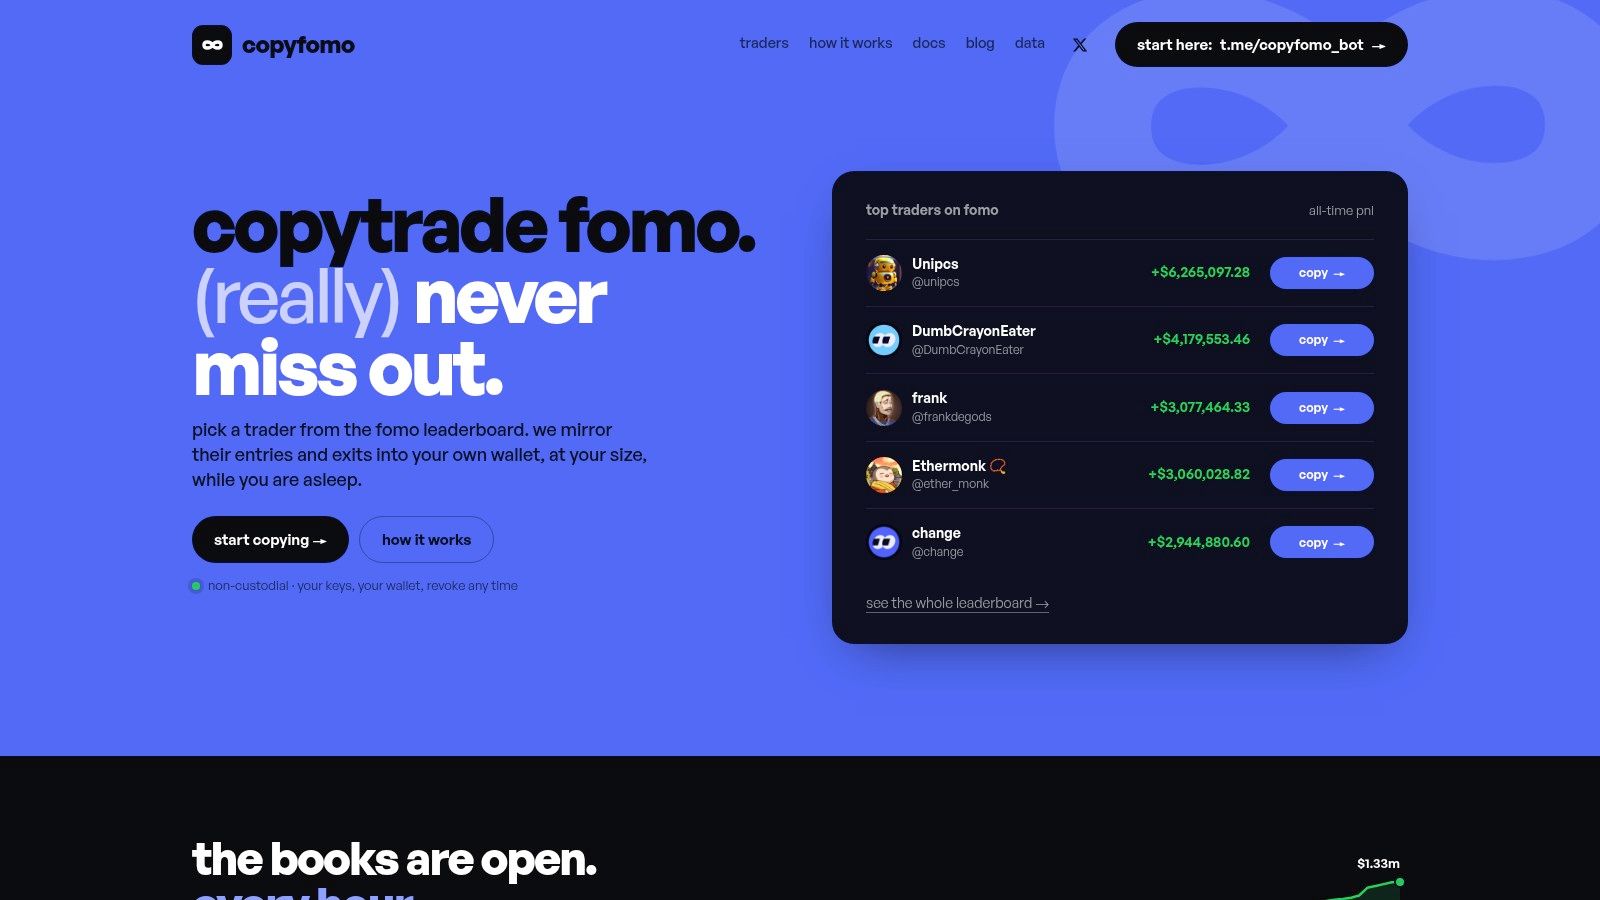
Most tools on this list stop at research. copyfomo is the execution layer for traders who already use fomo. It's a non-custodial Telegram bot that mirrors a selected trader's filled entries and exits into your own wallet, typically about one second after the source fill.
You pick a trader ranked by realized PnL from filled trades. You set a fixed ticket or proportional sizing with a cap. The bot copies sells as well as buys, so you're not left managing exits alone. It runs while you're offline.
What you control
Execution runs on a user-granted trading allowance. Assets stay in your wallet. You can pause new copies, close open mirrored positions, or revoke access. The principle matches the Ethereum ERC-20 specification, where approve lets a spender withdraw only up to an approved amount and a new call replaces the allowance.
- Sizing: Fixed ticket or proportional size, with an optional per-trade cap.
- Visibility: A live feed shows each copied swap and its per-trade slippage.
- Discovery: Look up a trader by handle or profile screenshot, including traders outside the leaderboard top 100.
Slippage display matters. The Uniswap slippage guide defines slippage tolerance as the maximum acceptable price change while a transaction is pending, with swaps failing outside that range. A record per trade beats a headline PnL number.
The limits are plain. Your fills can differ from the source trader's, and copied trades can lose money. Pricing and independently verifiable customer results aren't provided, and leaderboard traders are unaffiliated. Judge it on your own copied results, not theirs.
2. Nansen
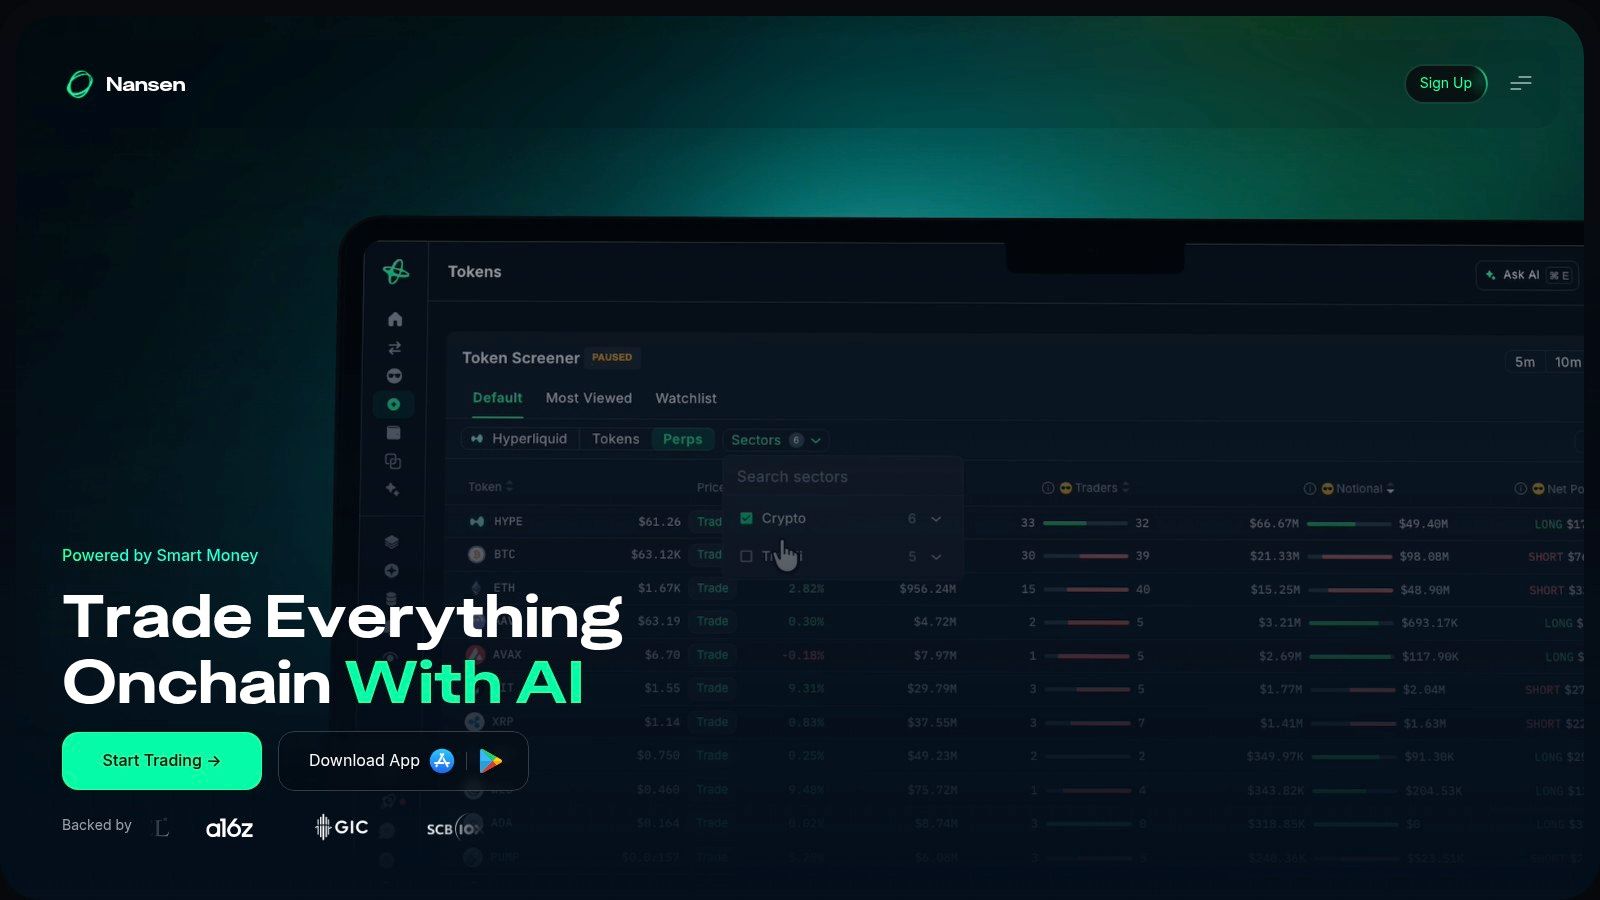
A raw wallet address tells you nothing on its own. Nansen adds the context around it. It researches and monitors. It does not place trades for you.
Smart Money labels, wallet PnL, and portfolio views turn addresses into something scannable. Watchlists and smart alerts ping you when a tracked wallet moves. Web and mobile access keep the monitoring portable.
Where it fits
Use Nansen to build a shortlist. Check whether a wallet's PnL is broad-based or rests on one lucky token. Check holding periods and position sizes. Then pull the raw trades on an explorer before you trust the label.
- Wallet labels: faster than reading an explorer, still an interpretation.
- PnL and portfolios: separates repeat traders from one-off winners.
- Alerts: useful for monitoring; execution happens elsewhere.
A free account covers the basics. Advanced features sit behind paid tiers, and current pricing is listed on the Nansen site.
The limit is the one every analytics tool shares. Labels and historical PnL don't predict future results. Nansen finds and watches wallets. Acting on what you see is still your job.
3. Arkham
Start with a transfer you don't understand. That's where Arkham earns its place. It investigates addresses, entities, and fund movements across several major chains, including Solana and Base.
Search spans addresses, entities, and transactions. The visualizer traces transfers and counterparties across hops. Custom alerts flag activity, and wallet pages show holdings, transaction history, and PnL views.
The attribution problem
Entity labels are investigative leads, not proof of identity. A review cited by Proof of Talk on onchain analytics reported one clustering service at an F1 score of 0.825 and another at 0.000. That spread is the point. Attribution quality varies, and some labels rest on thin off-chain evidence.
Practical rule: Treat every label as a hypothesis. Confirm it against transactions before you size a trade around it.
For following larger wallets, pair Arkham with a dedicated crypto whale wallet tracker workflow. The visual tracing clarifies multi-hop flows that a flat transaction list hides.
Casual token researchers may find the investigative depth more than they need. Enterprise and API access carry separate terms. Use Arkham when the question is who moved funds where, not which token to buy.
4. Defined
Defined skips macro dashboards and goes straight to traders. Discover Traders and token-specific Top Traders lists filter wallets by network, timeframe, PnL, win rate, volume, and swaps. You then open a wallet profile and read its trading history.
That focus makes it a cleaner starting point for copy research than broad analytics suites. You're not mining a general explorer for active wallets. The tool surfaces them, ranked.
Segmentation matters here. The Chainalysis 2025 geography of cryptocurrency report separates retail activity by identifying transactions below $10,000. Apply the same discipline. A wallet trading your size range tells you more than a fund-sized account.
- Performance filters: Compare PnL and win rate across timeframes, not one hot week.
- Wallet profiles: Read the actual trade history behind the ranking.
- Risk indicators: Use them to drop obvious bots and wash patterns early.
Rankings are a starting point, not a verdict. Defined notes that detection may not remove every bot or questionable wallet. Displayed PnL may miss costs or off-chain factors, and chain coverage varies. Shortlist here, verify elsewhere.
5. Birdeye
Say you've found a wallet on another tool and want the token context fast. Birdeye combines wallet research with market data in one place. Wallet Analyzer shows PnL, holdings, and trading activity. Smart Money tracking follows labeled wallets. Token pages add price, liquidity, and holder data.
That combination saves tab-switching. You can check a wallet, then check whether the token it just bought has a real pool behind it. Charts and alerts cover the monitoring side, on desktop or mobile.
What to watch
Coverage and features differ by chain. A wallet view that's complete on one network may be thin on another. Displayed performance also depends on tracked history and methodology, so two tools can show different PnL for the same address.
- Wallet Analyzer: PnL, holdings, and trades in a single view.
- Token and pool data: Price and liquidity context beside the wallet data.
- Alerts: Monitoring without a separate tracker.
The trader-facing product is described as free to use. API and institutional products carry separate access terms. Trading and analytics functions may sit in separate products, so check the domain you're on before connecting a wallet.
6. Bubblemaps
A holder list of two thousand addresses tells you little. Bubblemaps draws it as a map. Wallets appear as bubbles, sized by holdings, with lines for connections between them. Concentration and clusters become visible at a glance.
Historical distribution views show how a token's holders changed over time. Fund-flow and cluster exploration help you spot wallets that funded each other or received supply from the same source. Projects can embed the maps or use API options.
What a map can't prove
A visual connection doesn't establish common ownership. Shared funding can mean an exchange, a launchpad, or a payment, not one person running ten wallets. Treat clusters as questions, not answers.
A connected bubble is a reason to investigate. It is not evidence by itself.
Pair the map with a honeypot token checker routine and direct contract and liquidity checks. Visual analysis replaces none of those.
V2 is described as free, with some advanced features limited to BMT holders. For new or thinly traded tokens, Bubblemaps is a fast first pass on holder structure before deeper work.
7. Solscan
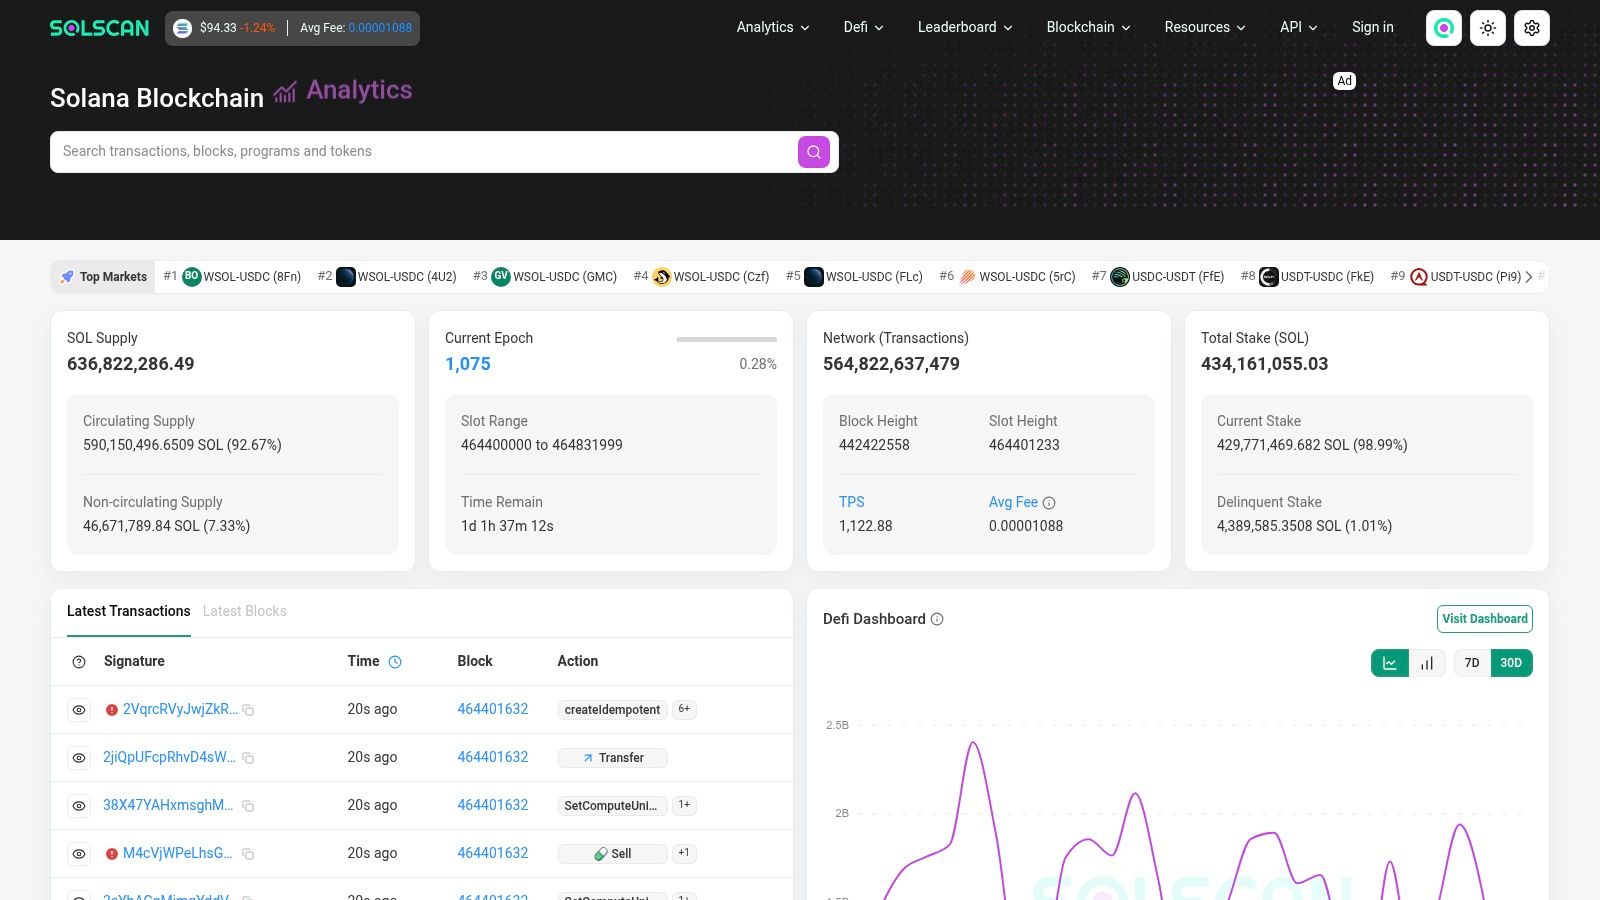
When a dashboard number looks wrong, go to the explorer. Solscan is the Solana-focused option. Account analytics show balance and transfer trends. Token analytics cover holders, trading activity, and supply. Transaction histories let you verify individual transfers and counterparties.
That's the verification layer in a Solana workflow. A ranking tool claims a wallet made a trade. Solscan shows the transaction itself, with amounts and timing you can read directly.
For ongoing monitoring habits, a structured Solana wallet tracker setup builds on this raw record. Solscan's readable charts make the explorer data less painful than parsing raw logs.
- Account analytics: Balance changes and transfer patterns over time.
- Token analytics: Holders, supply, and DEX activity in one place.
- Transaction history: The ground truth for any claim another tool makes.
The limits are scope and depth. It's Solana only, not cross-chain. Analytics charts cover selected periods, so long historical work needs other tools. Public explorer pages are open, while API access is separate. It's not a trader-ranking or copy system, and it doesn't pretend to be.
8. Dune
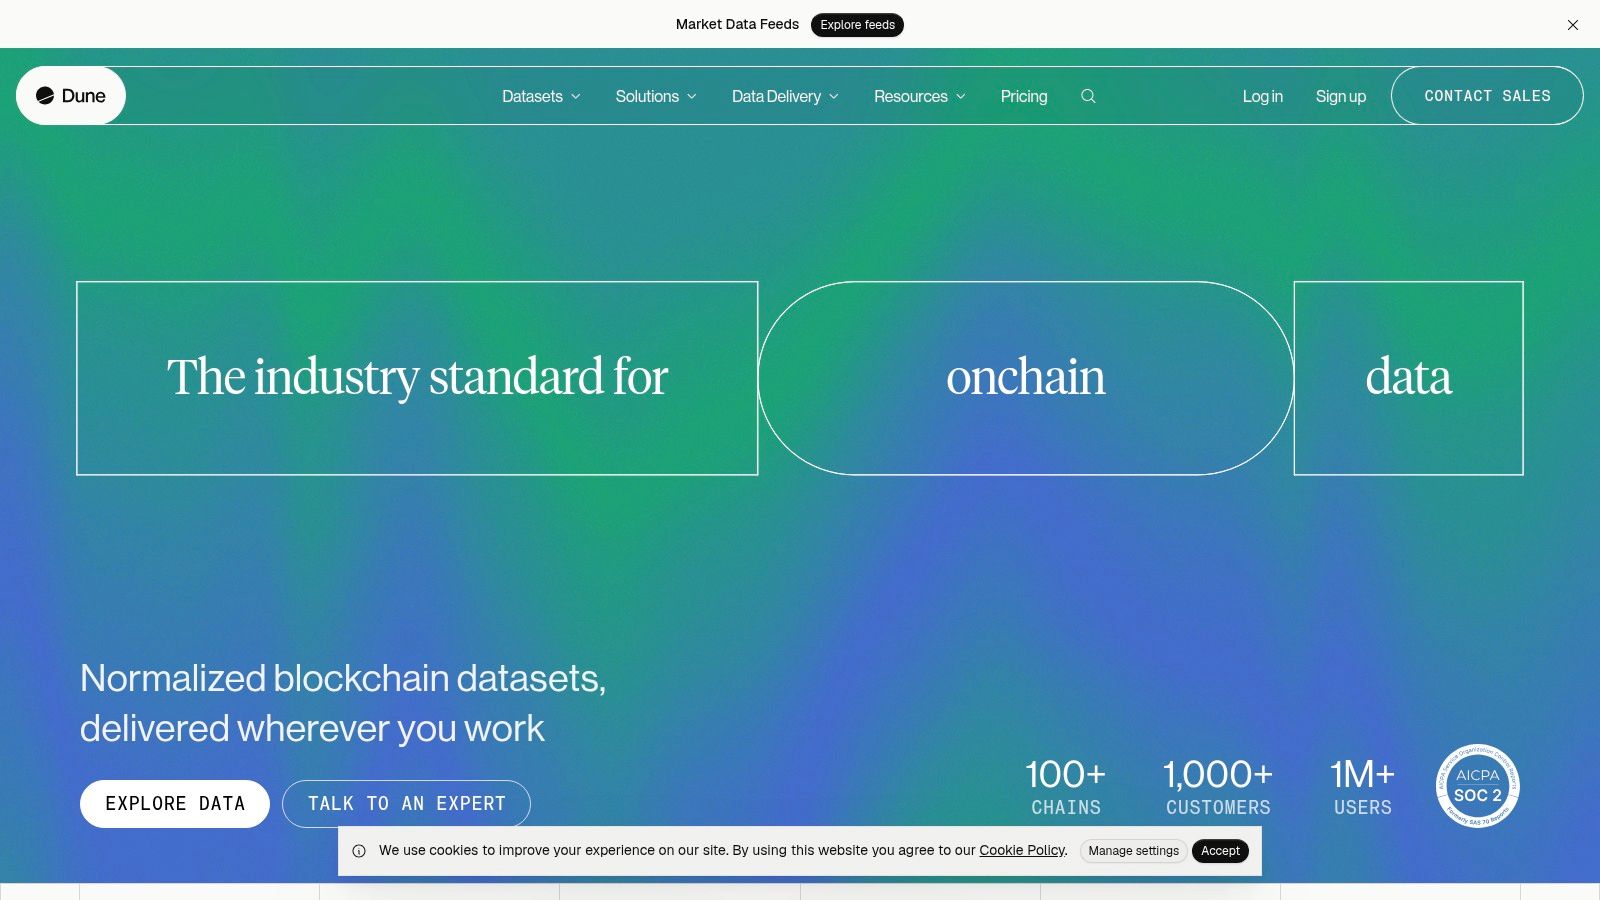
Preset dashboards answer preset questions. Dune is for the other kind. You query indexed blockchain data with SQL, build visualizations, and publish dashboards. Community queries give you a starting point for common analyses.
The methodology discipline transfers. The Chainalysis reports index describes an adoption index across 151 countries using four sub-indexes combined through a geometric mean and normalized to a 0 to 1 scale. Good Dune work follows the same logic. Keep metrics separate, normalize before ranking, and show your weighting.
The cost is effort
Custom analysis requires SQL. There's no way around that. Public dashboards are user-created, so the query logic can be wrong, stale, or selectively cherry-picked. Read the SQL before you trust the chart.
- SQL access: Query indexed datasets directly for questions preset tools can't answer.
- Shared dashboards: Reusable, but only as reliable as their authors.
- APIs and connectors: Pull results into your own workflow or alerts.
Free access exists, and paid plans expand query and API capacity. If you can't write or audit SQL, Dune is a reading tool at best. If you can, it's the most flexible item on this list.
9. DeFiLlama
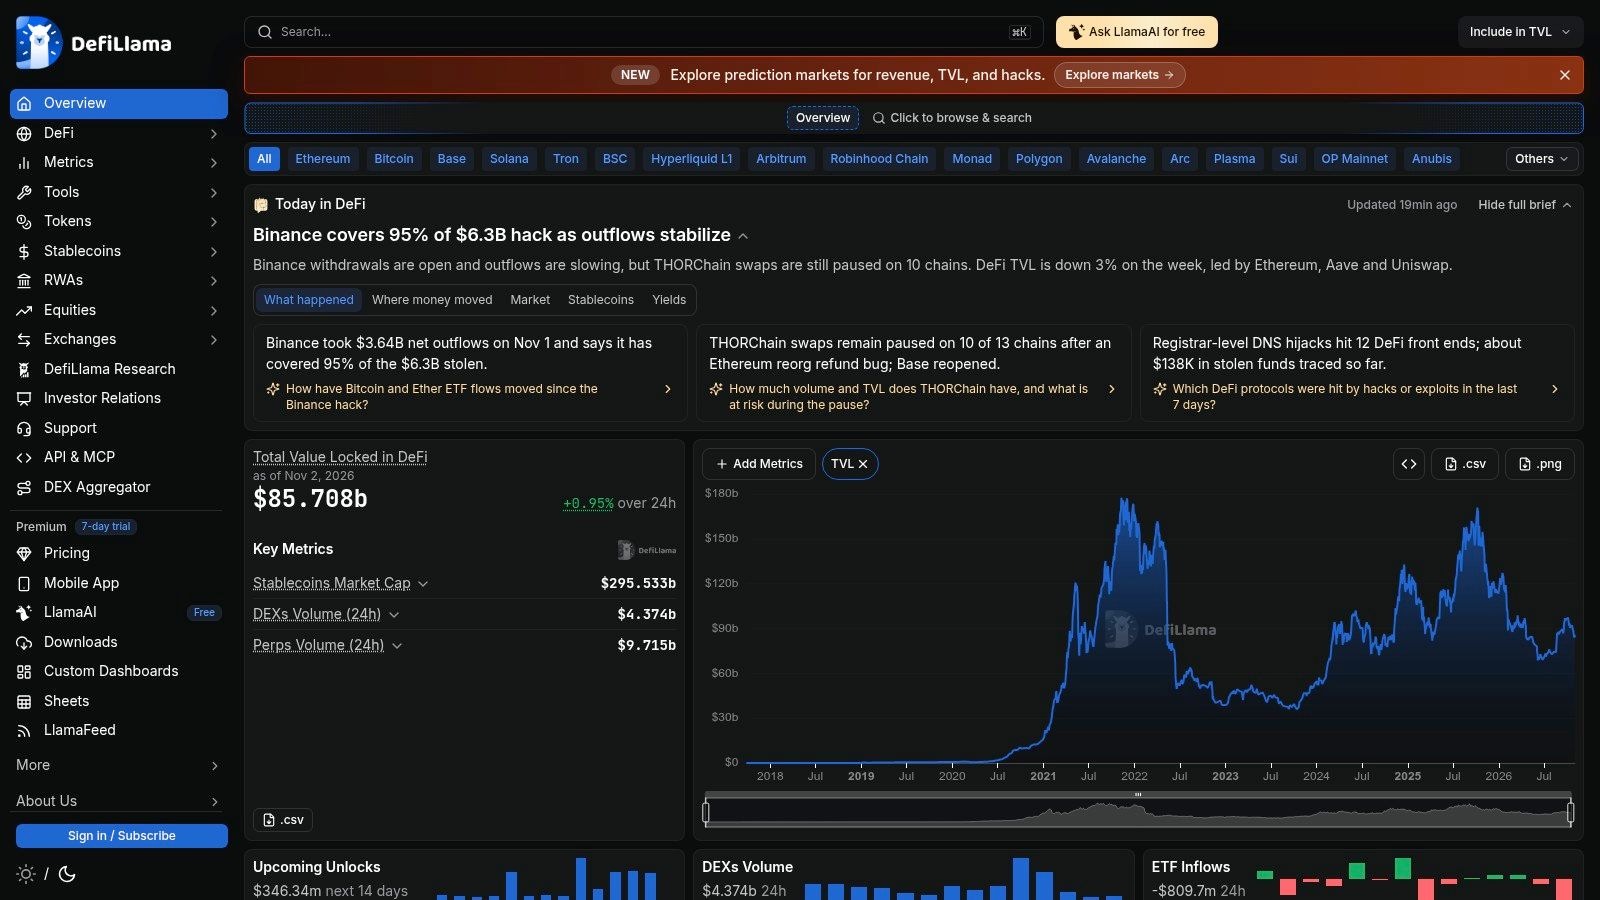
DeFiLlama maps the venue before you judge the trader. Protocol and chain dashboards track TVL, stablecoins, token emissions, and funding data across DeFi, so you can see whether capital is entering a market or draining out of it.
That context changes how you read a wallet. A profitable address inside a shrinking protocol may be trading into weaker exits, while the same record on a growing chain has deeper support behind it. Check the chain trend before copying the entry.
Read the venue, not the scoreboard
DeFiLlama is weak at individual wallet PnL and copy research. Treat it as the market-context layer: definitions and methodology shape the numbers, and TVL for the same chain can differ across trackers.
- Protocol and chain metrics: TVL and activity by category and network.
- Stablecoin dashboards: where dollar liquidity is parked.
- Token release and funding data: supply events that can hit price before volume confirms them.
A free plan covers the public dashboards, and paid tiers add API and enterprise options; check DeFiLlama's site for current plan details. Use it to size up the venue, then use wallet tools for the trader.
10. GeckoTerminal
Before you follow any wallet into a token, check the pool. GeckoTerminal tracks decentralized exchange pools across chains. Token pages show price, volume, liquidity, and recent transactions. Trending pair discovery surfaces where activity is concentrating.
This is the liquidity gate in the workflow. Grayscale Research on decentralized exchanges reported DEXs at 7.6% of global crypto trading volume in the first five months of 2025, up from 3% in 2023. More flow on DEXs means more thin, fragmented pools to check.
Liquidity decides your fill. The Uniswap developer documentation on swaps explains that a trade in a high-liquidity pool generally produces less price impact than the same size in a low-liquidity pool. The source trader's price is not your price.
- Pool comparison: Check depth across every pool for the token, not just the first result.
- Volume and transactions: Confirm real activity behind a price move.
- Public API: Market and pool data for developers building their own checks.
GeckoTerminal won't tell you whether a wallet is profitable, and it doesn't copy trades. It tells you whether the market can absorb yours.
The Ten Onchain Analysis Tools at a Glance
The table groups all ten by the job each one does in a trading workflow, from wallet discovery through to execution. Scan the Primary Job column first; the rest is detail.
| Item | Primary Job | Chain Coverage | Free Access | Best For |
|---|---|---|---|---|
| copyfomo | Automated copytrading of fomo leaderboard traders | Robinhood Chain, Base, BNB, Solana | Free trader alerts, wallet watching, and /find searches | Mirroring trader entries and exits in your own wallet |
| Nansen | Wallet research and monitoring | Multiple chains | Free account available | Wallet labels, PnL, and alerts |
| Arkham | Address and fund-flow investigation | Several major chains, including Solana and Base | Public access; enterprise and API terms are separate | Tracing entities, transactions, and transfers |
| Defined | Discovering and evaluating active traders | Multiple networks | Public access | Filtering trader wallets by performance |
| Birdeye | Wallet and market research | Multi-chain | Trader-facing product described as free | Combining wallet activity with token and market data |
| Bubblemaps | Visualizing token holders and wallet connections | Multiple major chains | V2 described as free; some advanced features require BMT | Investigating holder concentration and wallet clusters |
| Solscan | Solana wallet and token exploration | Solana | Public explorer and analytics pages | Checking Solana transactions, holders, and wallet activity |
| Dune | Custom on-chain data analysis | Indexed blockchain datasets | Free access; paid capabilities vary by plan | Building SQL queries and custom dashboards |
| DeFiLlama | DeFi protocol and ecosystem research | Broad chain coverage | Free plan available | Comparing protocol activity, liquidity, and yields |
| GeckoTerminal | DEX pool and token market tracking | Multiple chains | Public tracker and API available | Checking token pools, liquidity, and trading activity |
Nine of these analyze. One executes. That split is the point of the table: research tools tell you what a wallet did, and the last row of the workflow is where a trade happens.
From Research to Execution Picking Your Stack and Managing Risk
No single platform covers discovery, verification, liquidity, and execution well. Stack tools by task. Expecting one dashboard to do everything is how traders end up trusting a label they never checked.
A concrete workflow looks like this. Use Defined or Nansen to find candidate wallets and read their PnL across timeframes. Open Arkham when you need to know whether an address is a trader, a fund, or an exchange wallet. Verify specific trades on Solscan if the activity is on Solana. Check the token on GeckoTerminal and Bubblemaps before acting, since pool depth and holder concentration decide whether an exit exists at all.
Then keep a monitoring layer running. Alerts from a wallet tool tell you when your shortlist moves. Dune covers the custom questions that preset dashboards can't answer, provided you can audit the query. DeFiLlama tells you whether the protocol and chain behind a trade still hold real activity.
Workflow check: If you can't name which tool verified the wallet, which one checked the pool, and which one records your own result, the stack has a hole in it.
Know where research stops. Analysis tools don't act on your behalf. An alert at 3 a.m. is still a manual trade you have to wake up and place, at whatever price the pool offers by then. Headline PnL on a leaderboard also isn't your PnL. Your size, your delay, and your slippage produce a different result, sometimes a worse one.
For traders who already use fomo, the execution layer is where we fit. Our /find flow identifies a fomo trader's wallet from a handle or profile screenshot and refuses rather than guessing, so you're copying a verified decision-maker instead of a lookalike address. We copy on Robinhood Chain, Base, BNB and Solana, with sizing, caps, and take profit or stop loss stored per trader.
Measurement closes the loop. Our /copies view reports realized and open PnL per copied trader, and trade history lists every closed position with the amount in, the amount out, and entry and exit market caps. That record, not the source trader's leaderboard line, is how you judge whether copying that trader works at your size.
State the risk plainly. Copy trading carries risk. Past performance does not predict results. A trader's next hundred trades can lose money, and your copies will mirror those losses with your own execution costs on top. Use caps. Start small. Review your per-trader numbers and cut what doesn't hold up.
Build the research stack first. Add execution only when you can verify wallets, check pools, and read your own results. To put that last layer in place, visit copyfomo.com to start the bot on Telegram.
You've got the research stack mapped. copyfomo handles the step after it, mirroring a verified fomo trader's filled entries and exits into your own wallet at your size, with slippage shown per trade. Start the bot on Telegram, set your caps, and judge it on your own numbers in /copies.
stop reading. start copying.
pick a trader from the fomo leaderboard, set your size, and the entries and the exits land in your own wallet while you sleep.
open copyfomo on telegram →